

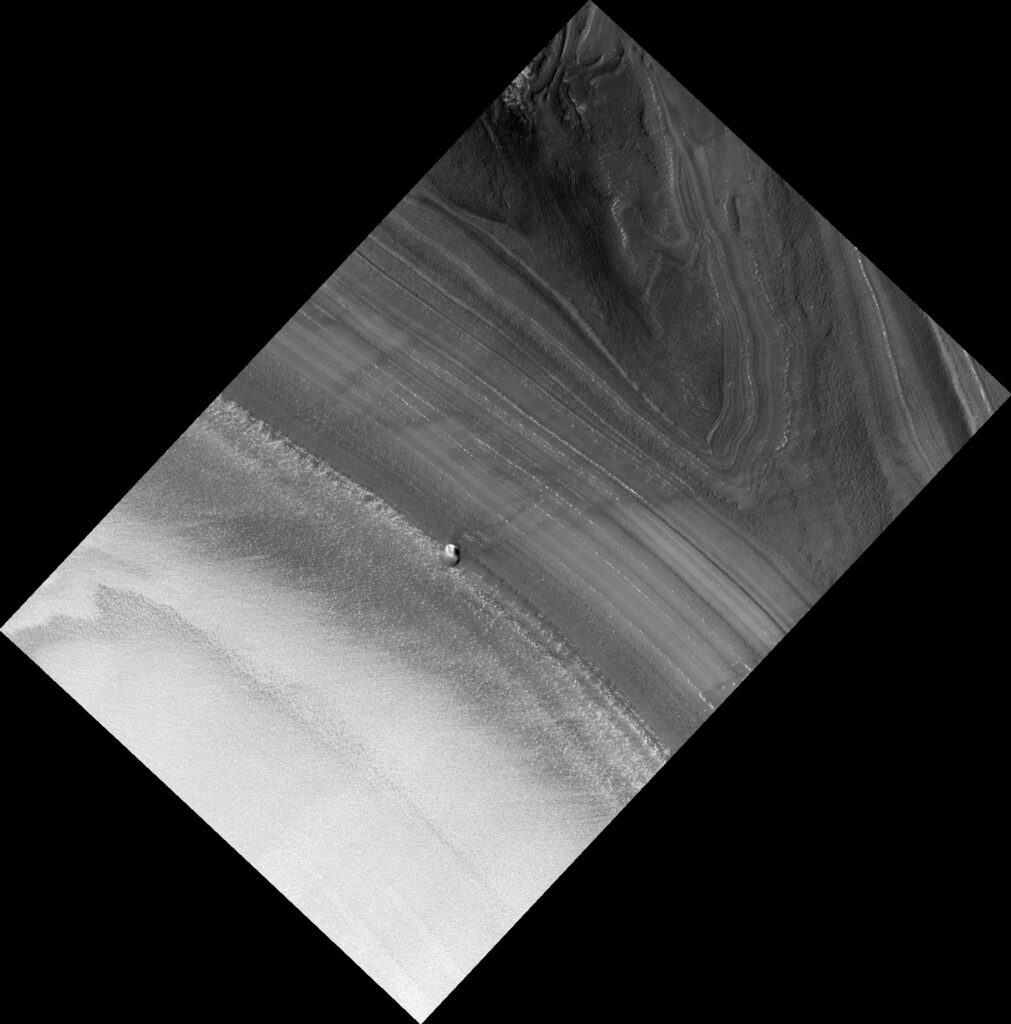
Mars keeps a climate archive at its north pole, written in stacked layers of ice and dust. Reading it means knowing whether the top layer is growing or shrinking today, and that is hard to measure across an entire cap. A new study suggests a shortcut: watch the small craters pitted into the Mars polar ice, and see what happens to the bright deposits on their floors.
The work, led by Grace Shore of Arizona State University, was published on 26 October 2026 in the Journal of Geophysical Research: Planets. The team used images from HiRISE (the High Resolution Imaging Science Experiment, a camera on NASA’s Mars Reconnaissance Orbiter) spanning almost a Mars decade, close to two decades on Earth. They followed 36 small impact craters on the Northern Residual Ice Cap, the bright layer of water ice that tops the North Polar Layered Deposits.
In 32 of the 36 craters, the bright floor deposits changed over time; in the other four, nothing noticeable happened. The changes tracked the frost outside each crater, the seasonal coating that comes and goes with the Martian year. The authors conclude that local seasonal frost, rather than one cap-wide trend, mainly governs what happens inside these hollows. They have also published their mapped deposit boundaries for others to check.
Craters make good gauges because they are sheltered. Their walls cast shade, which may let ice survive on a crater floor after the surrounding terrain has lost its own, as an earlier HiRISE image of a crater near 83 degrees north suggests. A crater floor works rather like a rain gauge. Gains and losses pile up in one small spot a camera can watch.
That matters for the bigger question. The mass balance of the top layer, meaning whether it gains or loses ice from year to year, is the key to interpreting the older layers beneath it. Dozens of crater floors offer repeatable measuring points instead of one blurred average for the whole cap.
The catch is that brightness is not thickness. The team mapped where bright material spread or retreated, but a change in area does not by itself say how much ice arrived or left. The link with outside frost is a correlation, and 36 craters on one cap is a modest sample. Turning these patterns into an ice budget will need topography and thermal modelling alongside the pictures.
Still, the idea is appealing. So few craters scar the bright cap that it may be only about 10,000 years old. The handful it does have are now earning their keep as instruments, each one a small dish collecting the planet’s weather.
